The Hidden AI Exposure in Your 'Diversified' Portfolio
The Short Version
If you bought VTI, VOO, or QQQ expecting broad diversification, here is the reality check: roughly a third of your money is now a direct bet on AI infrastructure—Nvidia, Microsoft, Apple, Broadcom, Meta, and a tight circle of hyperscalers.
You bought a total market index fund to avoid picking individual stocks. That was a sensible move. Here is the catch: the index picked them for you anyway.
Market-cap weighting automatically channels capital into whatever is already largest. In 2026, "largest" means AI hardware, chips, and cloud infrastructure. You didn't actively overweight Nvidia—the index engine did it on auto-pilot, doubling down on the position every time the share price surged.
Is VTI Actually Diversified in 2026?
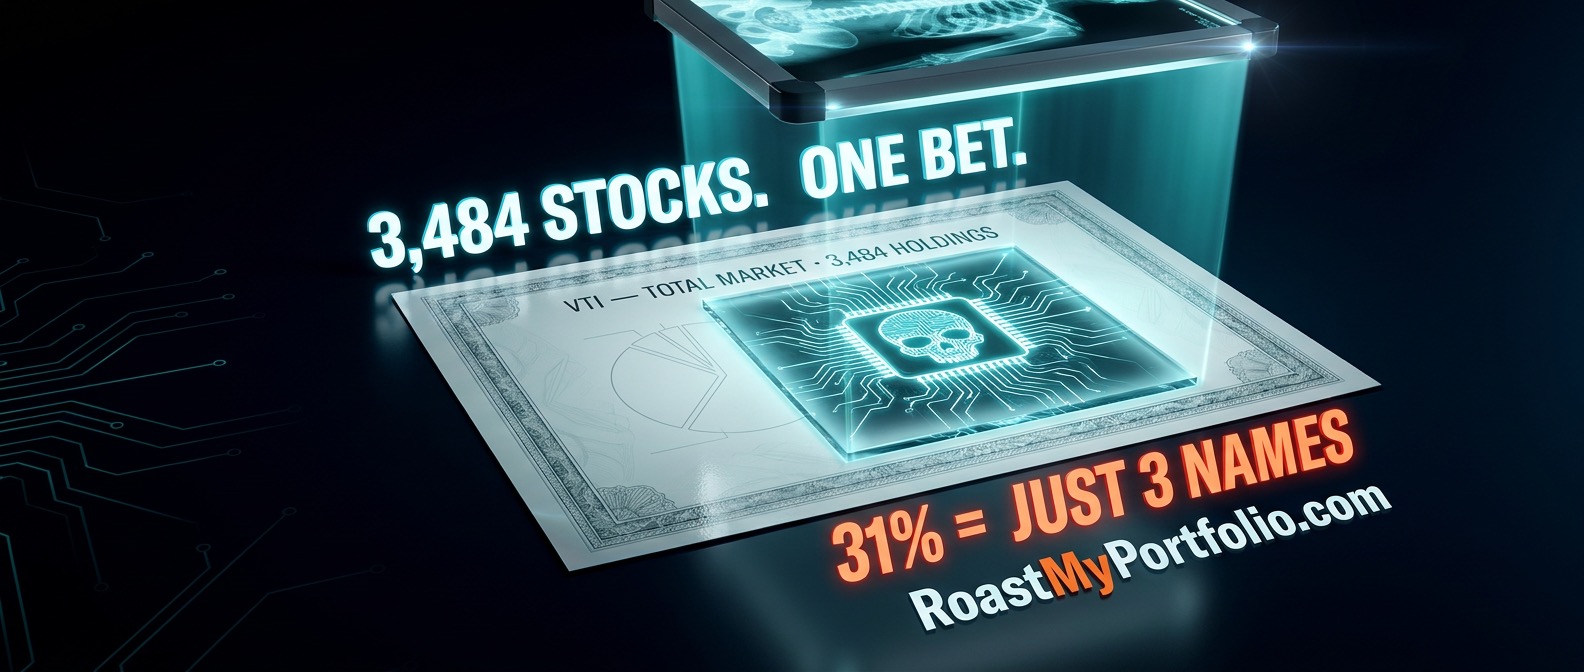
Vanguard's Total Stock Market ETF (VTI) holds approximately 3,484 individual stocks. That statistic is technically accurate—and fundamentally misleading.
Because VTI weights every holding by market capitalization, the bottom 3,000 companies barely register. What actually moves your portfolio comes down to a small handful of giants: Nvidia (~6.4%), Apple (~5.9%), and Microsoft (~4.4%). Together, these three names command over 16% of the fund.
Zoom out, and the technology sector alone swallows 31% of VTI's entire weight. (Source: mid-2026 data via stockanalysis.com and Vanguard's VTI Profile.)
Share of each fund held by just its top 10 holdings
Each bar represents 100% of the fund's total value.
How the S&P 500 Went From 19% to 40.7% in a Decade
From 1990 through 2015, the top 10 companies in the S&P 500 accounted for a balanced 18% to 23% of the index. That capital was distributed across energy, industrials, consumer staples, and financials—not a single concentrated narrative.
By late 2025, that top-10 share soared to a record 40.7%—more than double its historical baseline. Institutional analysts dubbed this shift "The Great Narrowing" (source: RBC Wealth Management). It marks the highest concentration in modern market history, comfortably eclipsing the dot-com bubble peak.
This isn't a fringe interpretation—it is explicitly disclosed in fund prospectuses. Vanguard’s own risk filings warn that market-cap index tracking can render a fund "non-diversified" under the Investment Company Act purely through price movements. No manager intervention required. It is simply the mechanical outcome of cap weighting.
Why This Concentration Escalated
- The Self-Reinforcing Feedback Loop: As a stock's market cap climbs, its weight inside the index grows. Passive inflows are then legally required to buy more shares, driving price and weight higher in an automatic loop.
- Concentrated Earnings Growth: A tight group of hyperscalers—Nvidia, Microsoft, Alphabet, Amazon, Meta, and Broadcom—captures the bulk of current corporate growth, vacuuming up index weight in the process.
- The Illusion of Multiple Funds: Stacking VTI, VOO, and QQQ across accounts does not dilute your risk. Because they share the same top holdings, you are simply buying the exact same trade three times.
Why Did the Nasdaq-100 Need an Emergency Rebalance?
This concentration risk isn't theoretical—it has already triggered regulatory guardrails.
In July 2023, mega-cap tech expanded so rapidly that the Nasdaq-100 breached tax-compliance limits for regulated investment funds. Nasdaq was forced to execute a Special Rebalance—a rare administrative intervention seen only twice before in the index's history (source: Nasdaq Press Release).
No companies were added or removed; the index provider simply had to manually step in and dial back the weights.
Let that sink in.
One of the most prominent benchmark indexes on Earth became so top-heavy that it risked breaking federal tax law. That warning light flashed in 2023, and the underlying force—cap weighting rewarding size with even more capital—has only accelerated since.
Does My 401(k) Have the Same AI Exposure?
Almost certainly. And it represents one of the largest blind spots in personal finance.
Target Date Funds (TDFs) are pitched as hands-off, all-in-one solutions. They fulfill one promise well: adjusting your stock-to-bond ratio as you age. What they do not do is rebalance the stock portion itself.
A 2050 Target Date Fund with an 85% equity allocation runs on the exact same cap-weighted total market engine as VTI. The product wrapper changes; the underlying exposure does not.
1. Audit your combined top 10 weight
Calculate your true concentration across all accounts:
- Combine your taxable brokerage, 401(k), IRA, and automated robo-advisor accounts.
- Holding VTI, VOO, and QQQ across separate accounts isn't diversification—it is leverage on the same handful of names.
- If your top 10 holdings exceed 40% across your total wealth, your portfolio warrants an immediate review.
Most investors have never calculated their aggregate top-10 exposure.
2. Introduce an equal-weight counterweight
Fixing concentration doesn't mean abandoning passive index investing:
- An Equal-Weight S&P 500 fund allocates capital evenly across all 500 companies (~0.20% each), eliminating mega-cap dominance.
- Blending cap-weighted and equal-weighted funds reduces single-stock dependency without requiring you to pick winners.
- This isn't a bet against AI—it is insurance against needing AI to win forever.
3. Put international equities and bonds to real work
Ensure your defensive allocations provide genuine non-correlation:
- International funds can carry similar mega-cap overlap if cap-weighted—verify global fund top holdings.
- High-quality bonds remain the cleanest, lowest-correlation offset to an equity-heavy portfolio.
- Set your asset allocation as a deliberate risk limit, rather than accepting whatever index defaults assign to you.
The Question Worth Answering
None of this suggests that AI leaders are bad businesses. Companies like Nvidia and Microsoft generate immense revenue and record cash flow.
The real question isn't whether AI infrastructure investments will ultimately pay off. The question is whether you intended to allocate a third of your life savings to that single bet through a fund whose marketing promised to spread your risk around.
Free Portfolio Check
You Now Know the Question. Get Your Answer.
The checker above gives you one number. The full X-ray adds what you are paying in fees, which of your funds hold the same companies twice, and where the concentration actually sits.
Frequently Asked Questions About AI Exposure and Index Funds
Is VTI actually diversified in 2026?
Less than the name implies. While VTI holds roughly 3,500 stocks, market-cap weighting means the top 10 names account for 31.8% of the fund. The tech sector alone makes up 31%, with Nvidia, Apple, and Microsoft driving over 16% of total weight.
How much of the S&P 500 is concentrated in AI or tech stocks?
The top 10 S&P 500 companies reached a record 40.7% of the index's total weight by late 2025—up from 19% in 2015. This represents the highest concentration on record, driven almost entirely by AI infrastructure and mega-cap tech.
Why did the Nasdaq-100 perform an emergency rebalance?
In July 2023, mega-cap tech growth caused the Nasdaq-100 to violate tax-compliance diversification rules for funds tracking it. Nasdaq executed a Special Rebalance—only the third in its history—to forcibly redistribute index weight.
Does my target date fund carry the same AI concentration?
Yes. Target date funds adjust your stock-to-bond ratio over time, but the equity portion usually tracks the same cap-weighted indexes (like VTI). The asset allocation changes, but the underlying stock concentration remains identical.
How can I reduce AI concentration risk without giving up index investing?
You can complement or substitute cap-weighted funds with equal-weighted S&P 500 index funds, audit your top 10 holdings across all accounts, and use bonds or international equities as genuine risk offsets.
Data sources (August 2026):
S&P 500 historical concentration trends sourced from RBC Wealth Management, "The Great Narrowing".
VTI holdings and sector breakdowns referenced via Vanguard VTI Profile and stockanalysis.com.
Nasdaq-100 Special Rebalance background from Nasdaq, Inc. Official Release.
Portfolio allocation parameters fluctuate with daily NAV. Figures provided are directional.
Educational content only; not financial advice. Consult a qualified fiduciary for personalized investment planning.
Related Articles
Sector Rotation: Is Your Portfolio Ready?
Sector leadership flips every 2–3 years, and concentrated portfolios pay the bill. How to check your real sector exposure and what to do when the rotation hits.
9 min readDiversification Illusion: The $15,514 Cost of Fake Diversification
You own 10 stocks and still have one bet. How to spot fake diversification, hidden correlation, and the tech-heavy echo chamber most portfolios fall into.
11 min readPortfolio Drift: Your 60/40 Became 82/18
A 60/40 portfolio drifted to 82/18 by 2022, costing $55K on $500K. Use our free calculator to check your own drift and get a rebalancing plan in seconds.
7 min read