Free · no signup
How much of your portfolio is AI?
VOO alone is 39.1% AI under the hood (led by NVDA, AAPL, MSFT) — 23.5 of the 26.3 points come from that one fund. By layer: 9.9% silicon, 8.2% other AI-linked, 8.2% software.
Fund breakdown
- VOO — 39.1% AI-Holdings, led by NVDA, AAPL, MSFT
- VXUS — 9.5% AI-Holdings, led by TSM, 005930.KQ, 000660.KQ
Top-10 holdings per fund, so the real figure is higher, never lower.
⚠️ Educational, not financial advice.
Real data, not an AI guess
Every finding comes with the numbers behind it.
A chatbot guesses what's inside your funds. We calculate it first, from daily market prices, the holdings each fund publishes and its published fees. The AI then writes the analysis, quoting the same numbers you see in the charts.
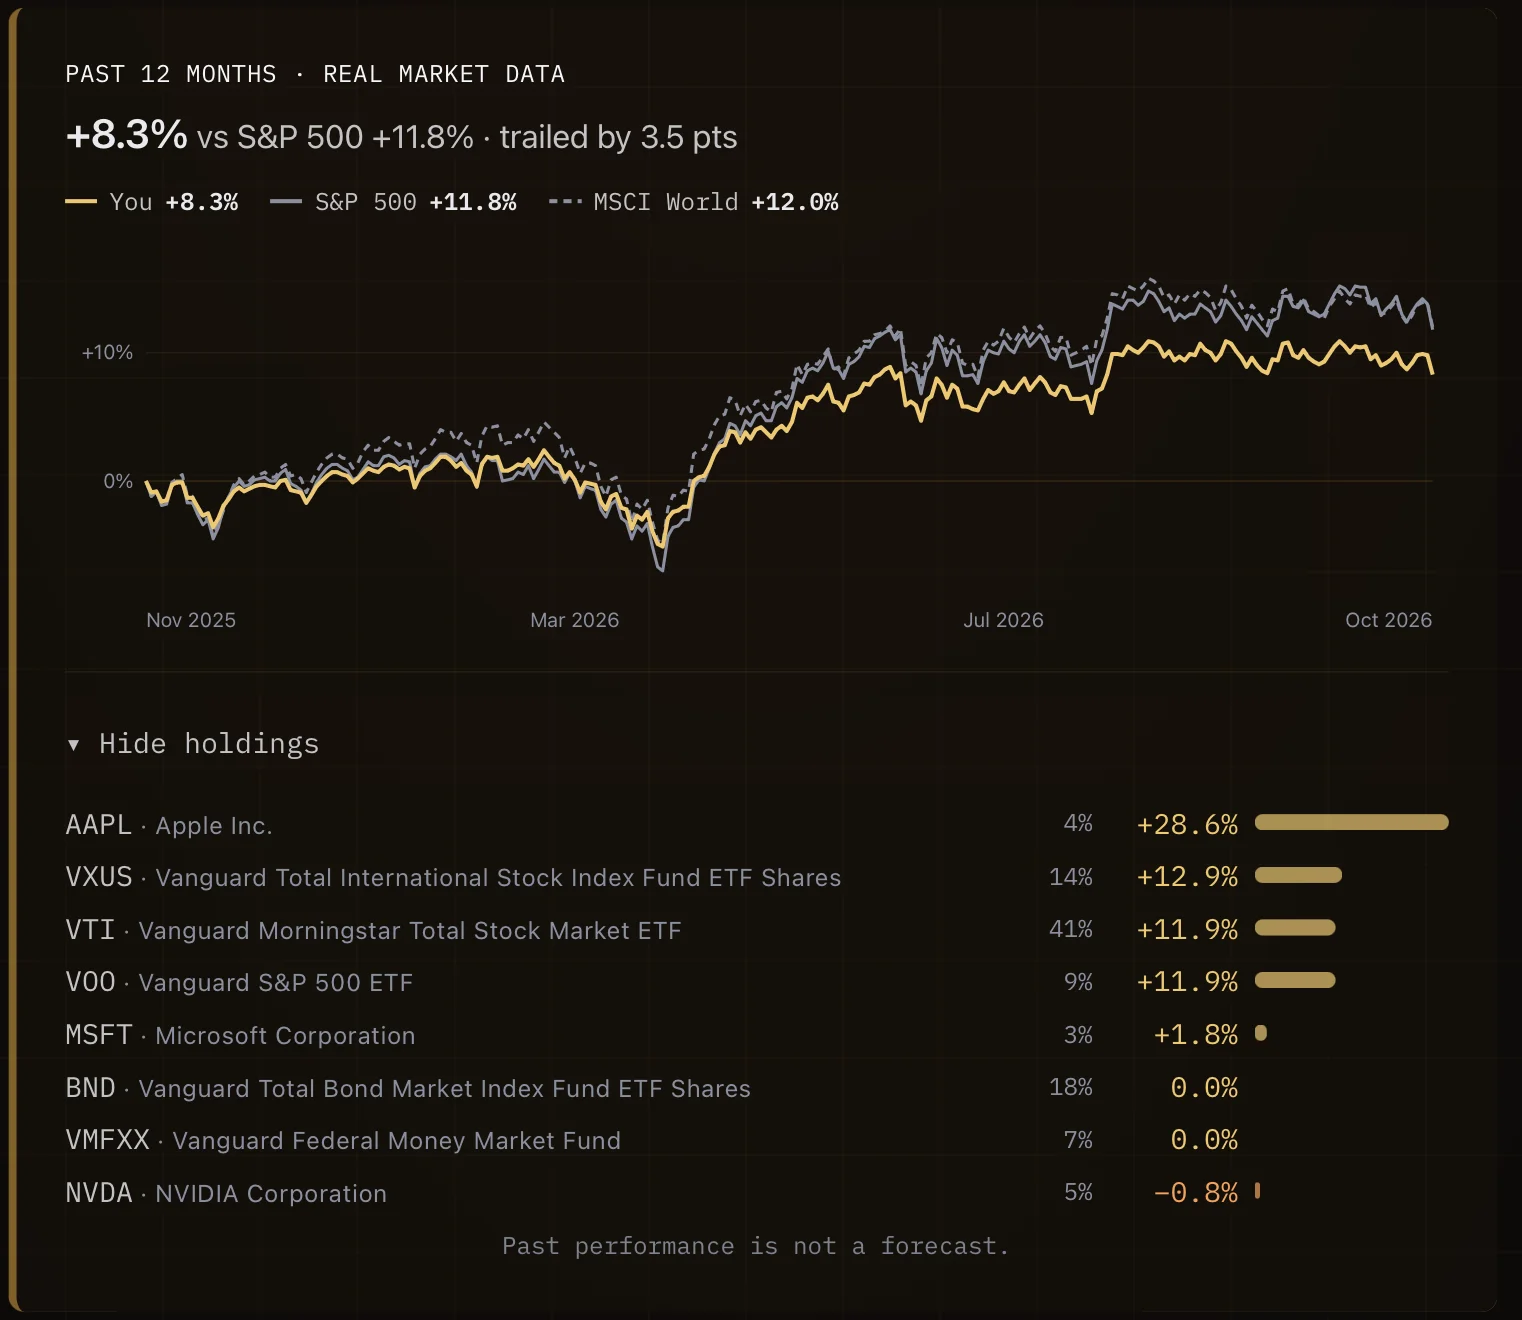
Source Daily closing prices of every holding, against the S&P 500 and MSCI World.
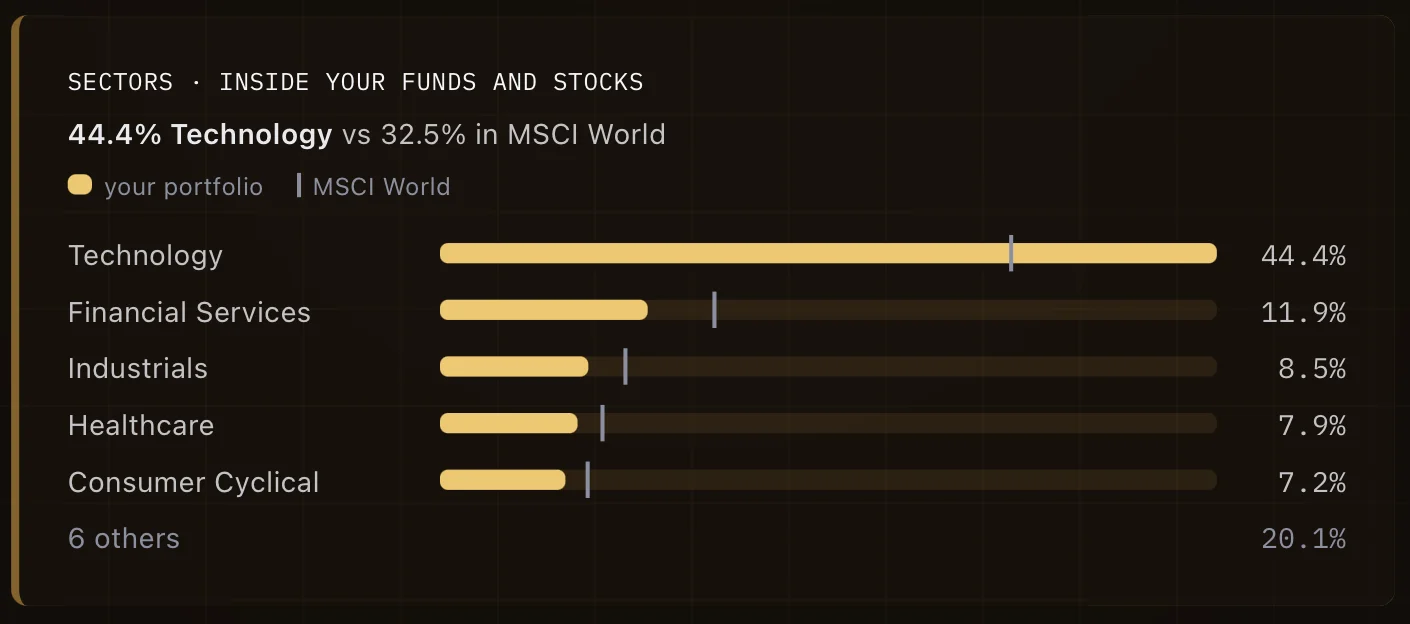
“Technology is 44.4% of holdings against 32.5% in MSCI World, a tilt toward one sector that concentrates risk in the companies driving that sector.”
Source Each fund's own sector weights, plus the sector of every stock you hold directly.
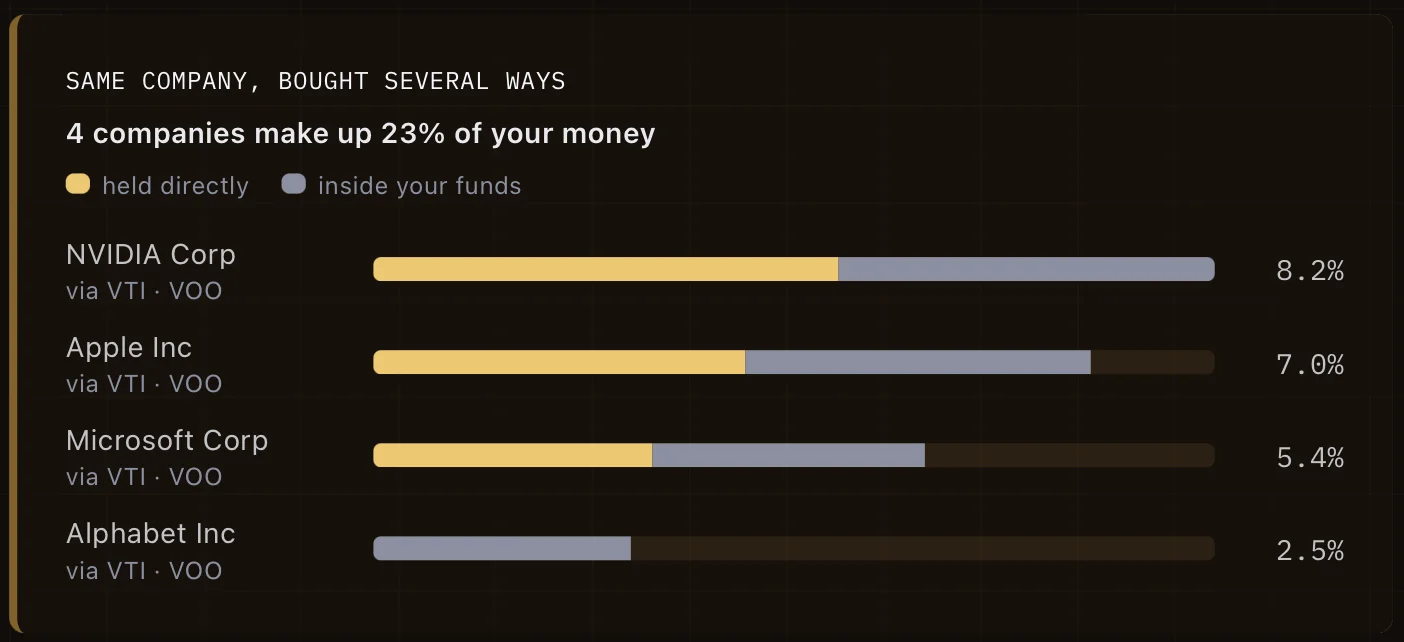
“23% of everything you own is the same 4 companies, held more than once: NVDA 8.2%, AAPL 7.0%, MSFT 5.4%, GOOGL 2.5%.”
Source The holdings each fund publishes, matched company by company with your direct stocks.
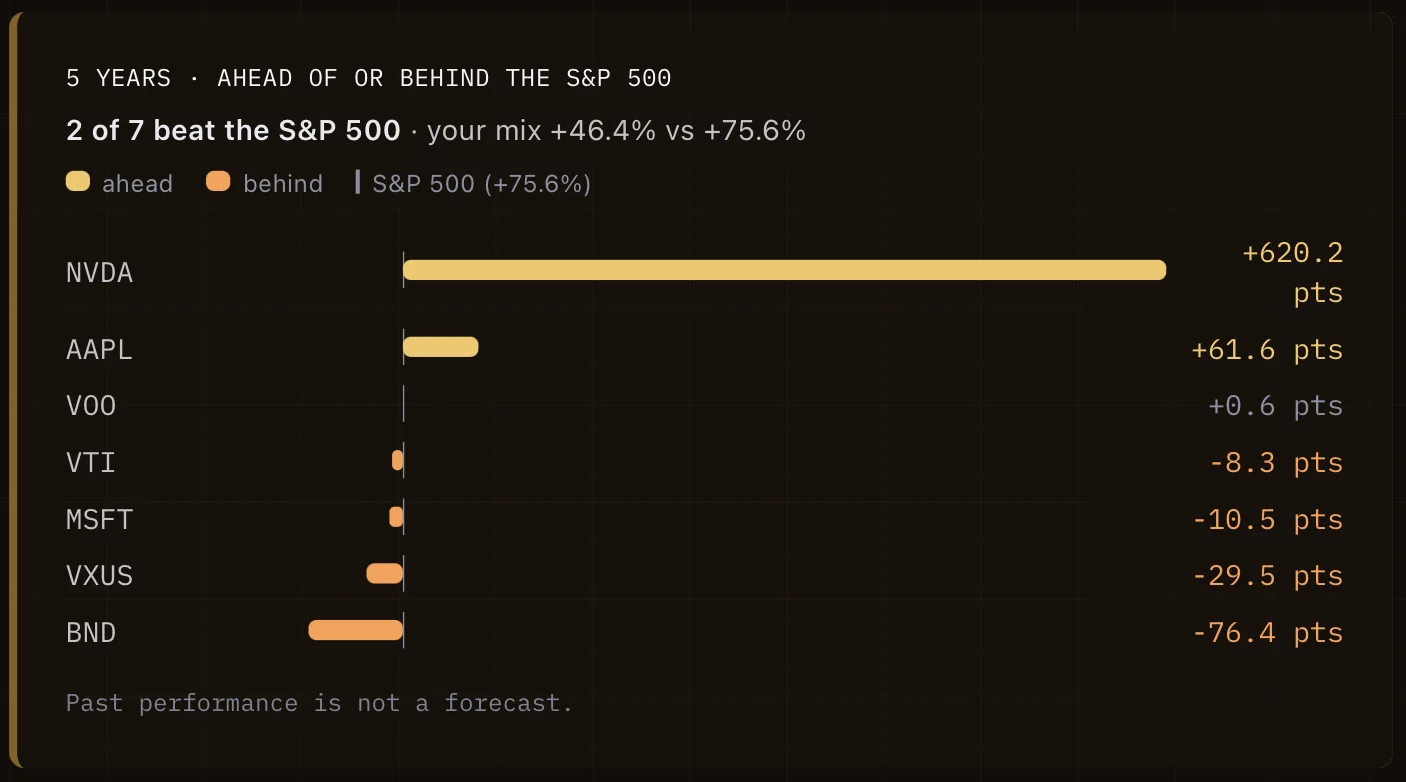
“NVDA returned +695.8% since November 2021, against +75.6% for the S&P 500.”
Source Five years of daily prices for each holding, compared with the S&P 500 over the same days.
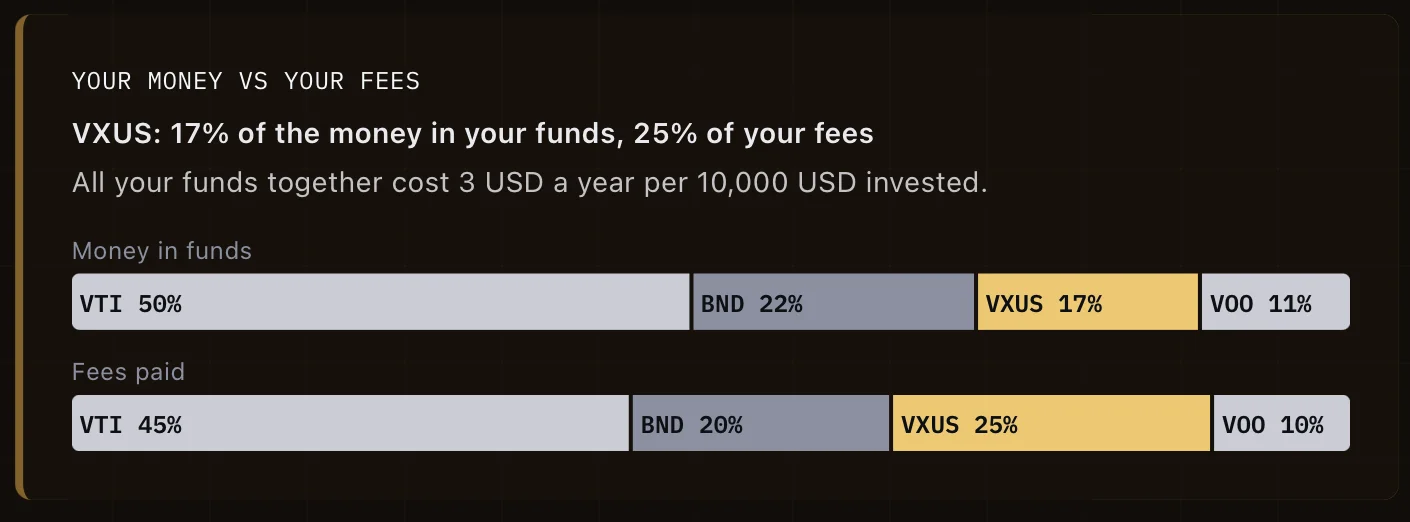
“VXUS holds 17% of the money in funds and pays 25% of the fees. The total fund cost is 3 USD a year per 10,000 USD invested.”
Source Each fund's published annual fee (TER), weighted by how much money sits in it.
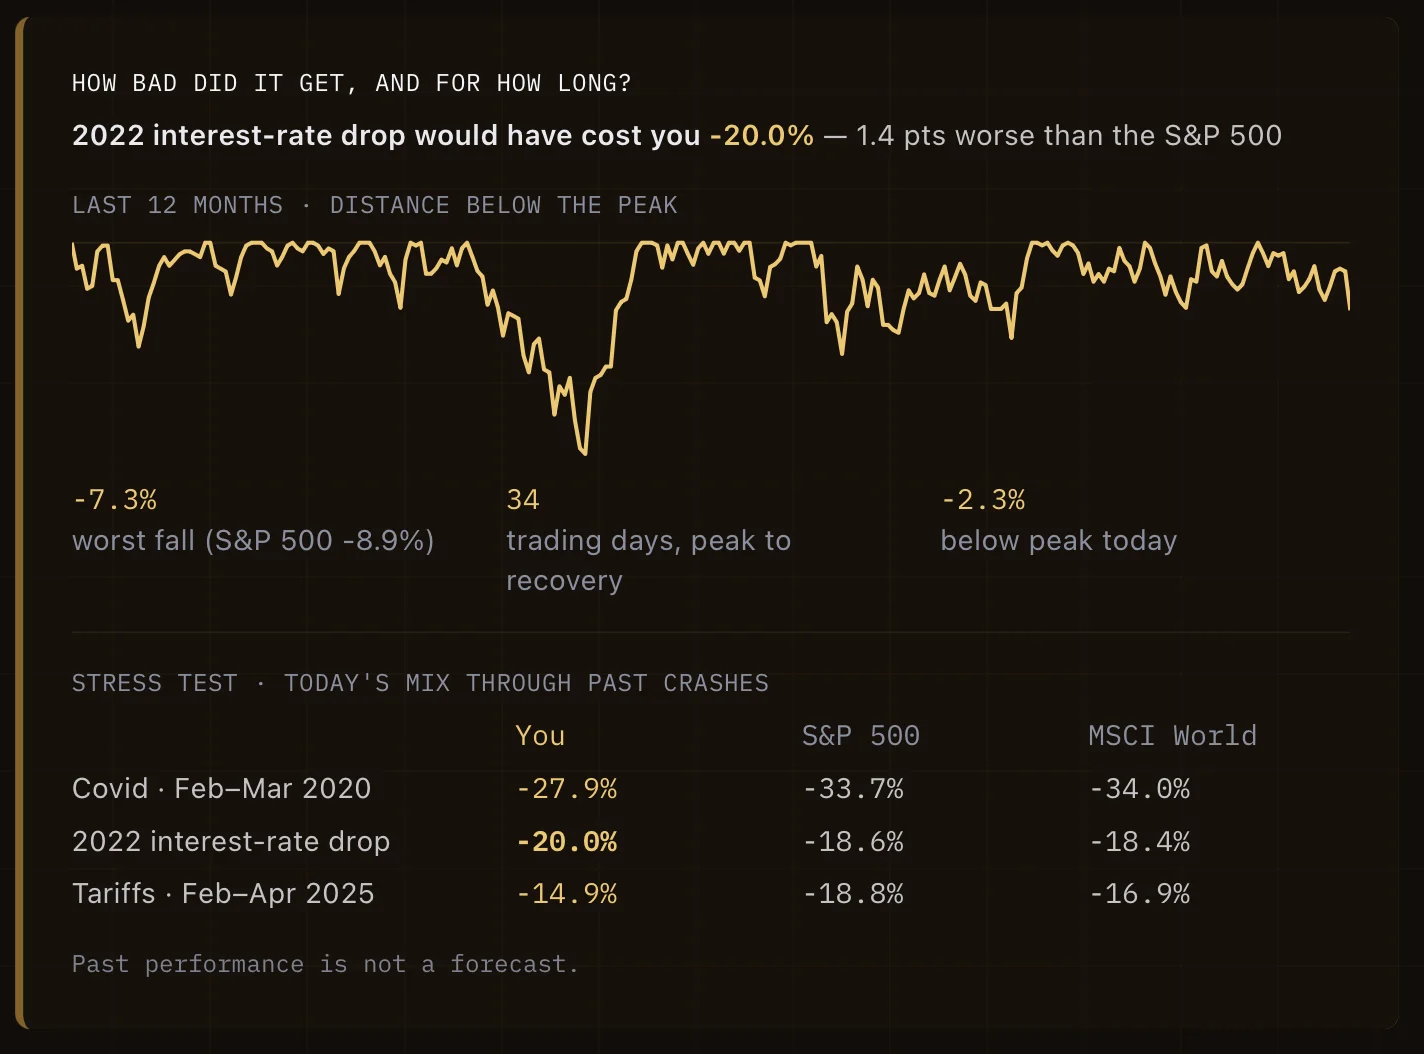
“In the 2022 rate-driven decline, the portfolio fell -20% against -18.6% for the S&P 500.”
Source Today's mix replayed day by day through Covid 2020, the 2022 rate shock and the 2025 tariff sell-off.