Stop Being the Exit Liquidity for Hedge Funds.
Track where the Insiders actually move their money
—not what they say on TV.
- Weekly Commercial Positioning— See where banks are betting
- Sentiment Extremes— Fade the retail crowd
- Beta Status— Lifetime discount on future features
Beta Access closes when we hit 1,000 subscribers.
Why You Keep Buying the Top.
The Retail Doom Loop
News says “Buy”
Retail buys the breakout everyone is talking about.
The Institutional Short
Commercials don’t guess. They are value traders hedging physical inventory. When they go short, they’re locking in profit. You’re just locking in a loss.
The Capitulation
Speculators (you) are leveraged trend-chasers. When the trend flips, you’re forced to sell. We wait for this exact moment to enter.
“You're trading against the house. We show you the house's hand.”
What You Get Every Friday.
Institutional data, decoded for humans
The 5-Year Extreme
We flag when Commercial positioning hits a 3-year or 5-year statistical extreme (Z-Score > 2.0). This is mathematically the highest probability point for a market reversal.
The Crowded Trade
We track Large Speculators. When they’re all-in (100% Long), there’s literally no cash left to push the market higher. That’s when we short.
Nurse’s Prescription
No fluff. No “it depends.” Just “Long,” “Short,” or “Stay Away.” Every Friday in your inbox.
How We Analyze the Markets
- 01CFTC data ingestion: Every Friday we pull the Disaggregated and Traders in Financial Futures reports directly from the CFTC—public, regulatory data covering Gold, Silver, Copper, Crude Oil, S&P 500, Nasdaq 100, and Bitcoin futures.
- 02Positioning normalization: Net positions are normalized to a 0–100 scale against 3 years of history. Z-Score extremes (>2.0 or <-2.0) flag the highest-probability reversal setups.
- 03Divergence detection: We flag when Commercial hedgers and Managed Money speculators take opposite sides at extremes—the “Smart Money vs Herd” divergence that historically precedes major moves.
- 04Price context enrichment: Each asset is enriched with live market data—current price, weekly and monthly momentum, SMA50/200 trend alignment, golden/death cross detection, and 52-week range proximity.
- 05AI-generated diagnosis: All metrics are sent to Google Gemini, which produces a structured per-asset diagnosis—positioning vitals, market diagnosis, price setup, and a watchlist with severity ratings. Delivered to your inbox every Friday.
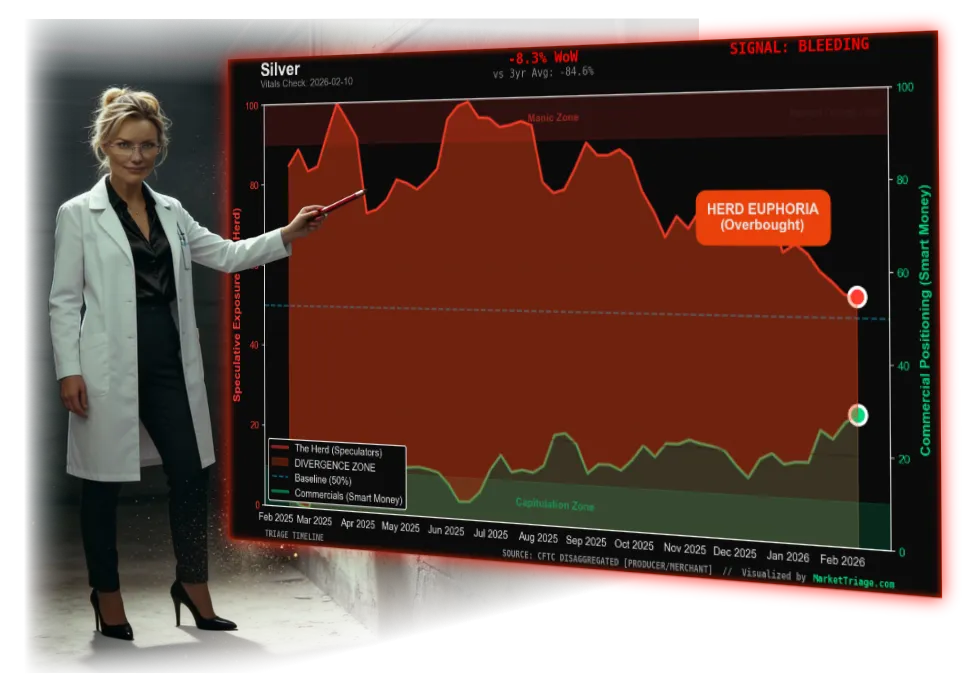
Clinical Proof: The “Herd Euphoria” Trap
Case Study: Gold Sentiment Extreme (The Top Signal)
Look at the chart. The Red Zone is the Herd chasing the rally into the “Manic Zone” (Max Long). They bought the exact top. Meanwhile, the Green Line (Smart Money) was aggressively selling into their greed.
The Diagnosis: A textbook “Extreme Positioning” setup. When Speculators reach a historical extreme (Z-Score > 2.0) while Commercials are selling, the trend is exhausted. The Outcome: We called “Time of Death” right at the peak. The Herd got slaughtered.
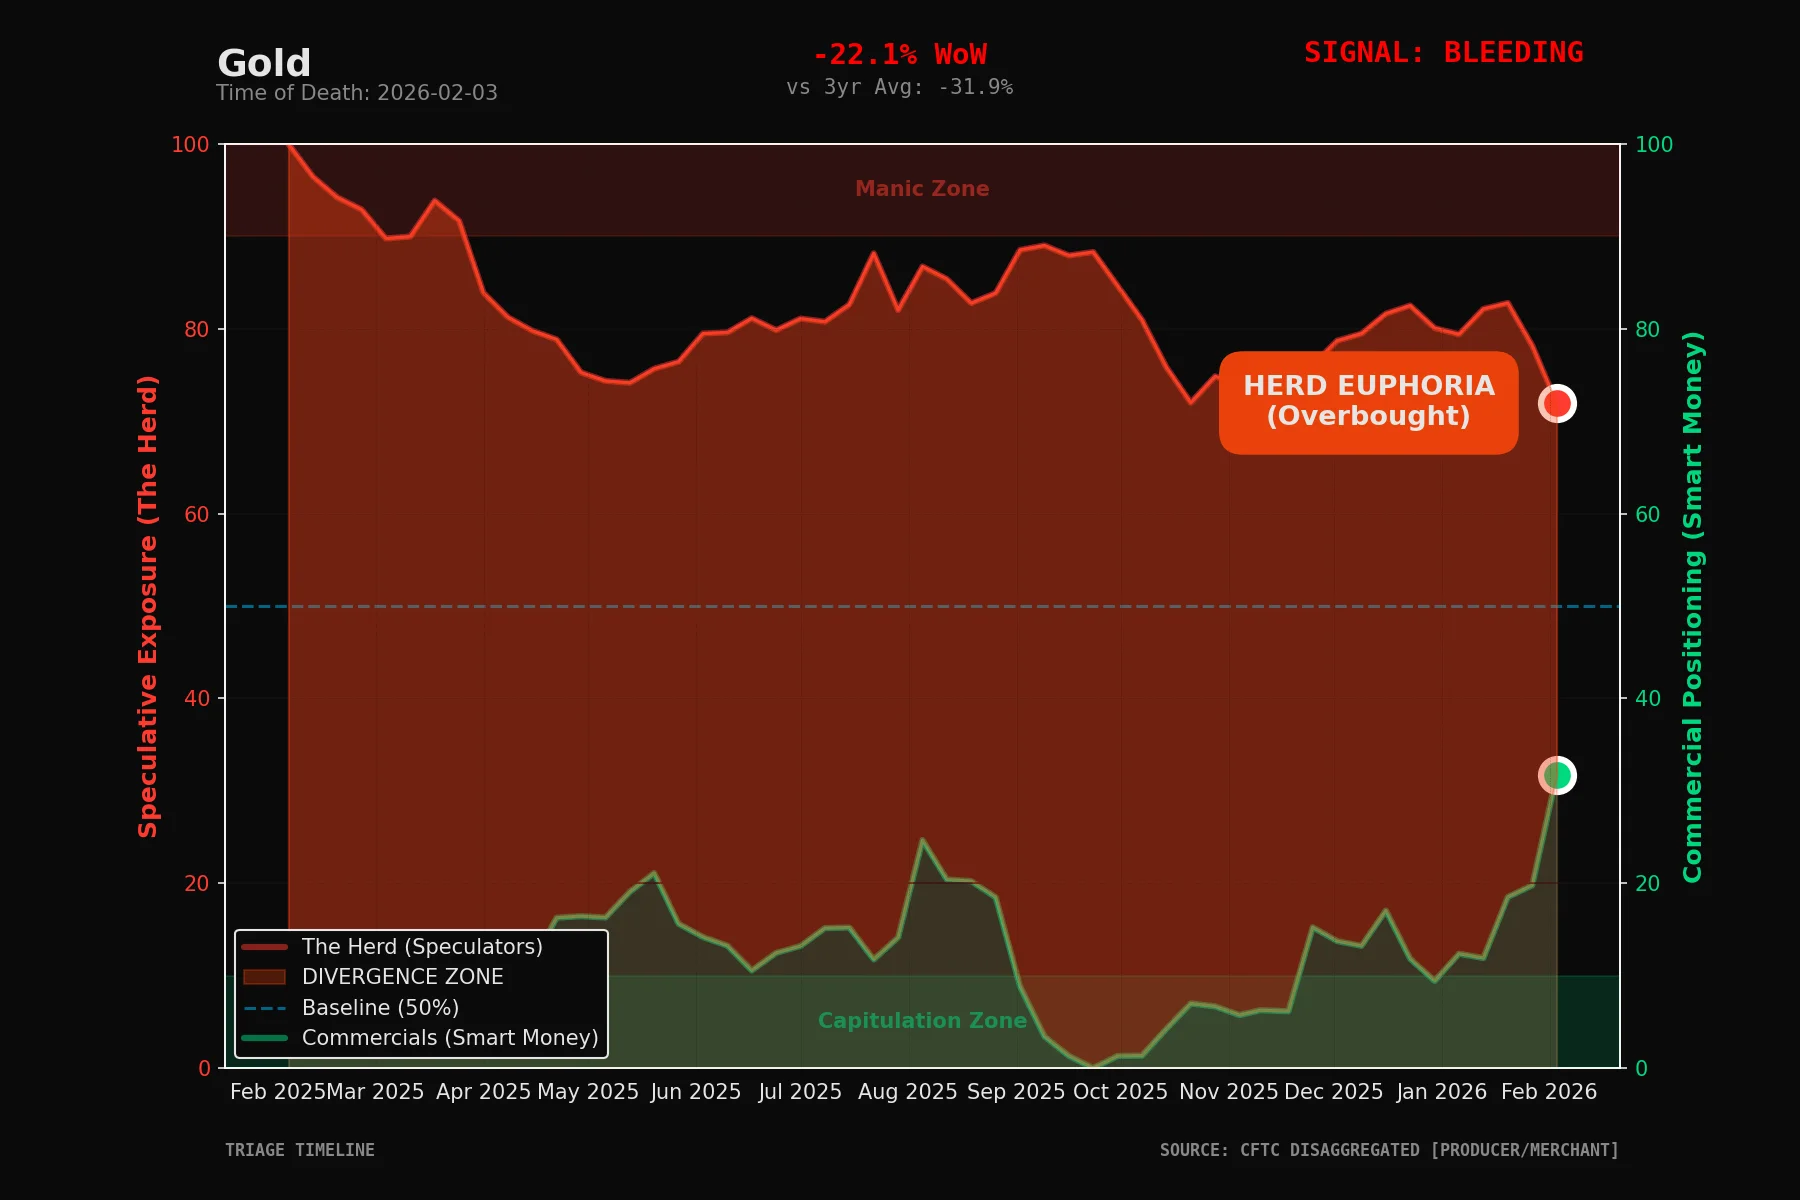
Smart Money (Green Line): The Producers (Miners & Bullion Banks). They hedge by selling when the price is too high.
The Herd (Red Line): Retail Speculators chasing the breakout. They provide the exit liquidity for the banks.
The Signal: We short when the Herd enters the “Manic Zone” and Commercials exit. The math implies the rally is dead.
This is the kind of signal our subscribers get every Friday. No chart-reading required—we do the translation.
Frequently Asked Questions
Everything you need to know about the COT Report
Ready to See the Smart Money?
- Weekly Commercial Positioning— See where banks are betting
- Sentiment Extremes— Fade the retail crowd
- Beta Status— Lifetime discount on future features