Why Missing 10 Best Days Costs You $228K
The behavior gap is the difference between investment returns and investor returns, caused by emotional decisions like panic selling and performance chasing. Research shows this gap costs investors 1.5–3% annually—meaning they consistently underperform the very funds they own.
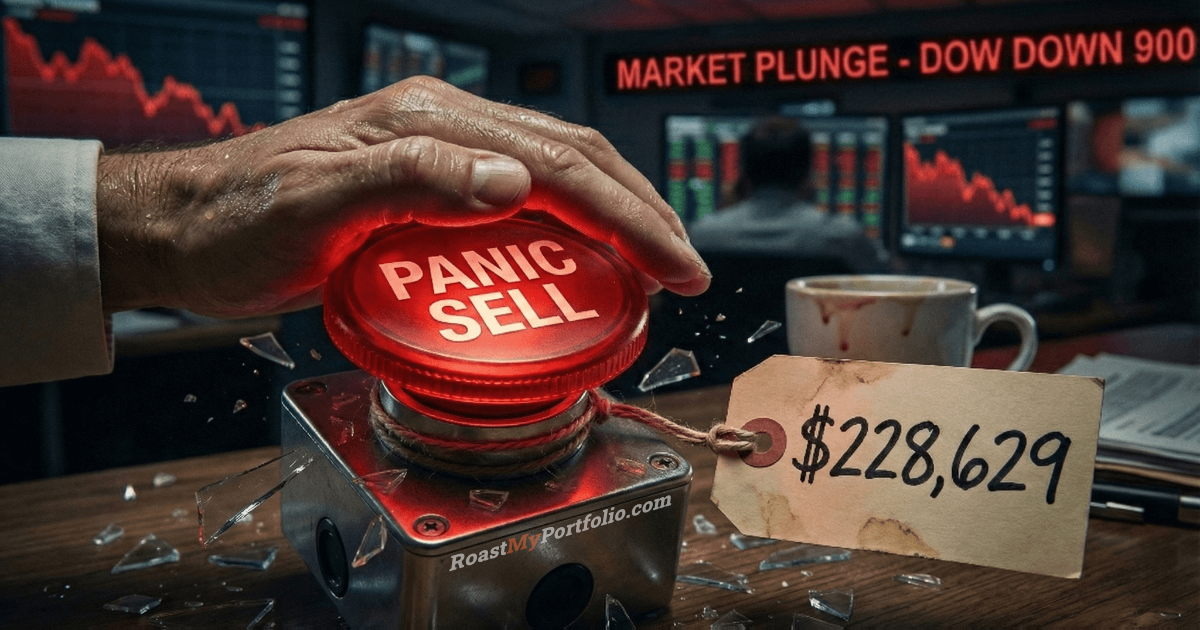
From 2000-2024, a buy and hold strategy in the S&P 500 delivered 7.5% annual returns. But if you missed just the 10 best trading days during this period, your return dropped to 3.4%. That's a 4.1% annual gap—and on a $100,000 investment, it cost $228,629 in lost wealth over 20 years.
This isn't due to fees, bad stock picks, or bear markets. It's 100% emotional investing mistakes—panic selling at bottoms, sitting on cash during recoveries, and attempting to time the market. The cruel irony? 6 of the 10 best days occurred within 2 weeks of the 10 worst days. When you sell in fear, you miss the recovery.
- Missing the 10 best market days since 2000 cost investors $228,629
- 6 of the 10 best days occurred within 2 weeks of the 10 worst days
- The market has a 100% recovery rate from every bear market in history
- A written plan and automation are the keys to closing your behavior gap
Would You Have Held Through These Crashes?
It's easy to say "I'd hold through a crash" when your portfolio is green. But when you're down 30% and CNBC is screaming "worst crisis since 1929," your brain goes into fight-or-flight mode. The key is having a disciplined diversification strategy that keeps you invested. Try the simulator above to see if you'd actually follow your plan.
Get your free portfolio analysis and find out.
Inside Your Brain During a Crash: Why We Panic Sell
Loss Aversion: Losses Hurt 2.5x More Than Gains Feel Good
Daniel Kahneman's Nobel Prize-winning research on loss aversion explains the investment psychology behind panic selling: losing $10,000 causes 2.5x more emotional pain than gaining $10,000 causes pleasure. During a crash, this asymmetry overwhelms rational decision-making. Investors with concentrated positions experience even greater psychological pressure to sell.
When your portfolio drops 20%, your brain screams "STOP THE BLEEDING!" even though history shows that's exactly when you should be buying, not selling.
Recency Bias: The Last Thing You Saw Feels Like Forever
During the March 2020 COVID crash, the market dropped 34% in 23 days—the fastest crash in history. Investors who sold at the bottom thought: "This time is different. The entire economy is shutting down. It'll take years to recover." This same recency bias drives performance chasing behavior—investors pile into whatever worked recently.
What actually happened: The market recovered to new highs in just 5 months. Investors who held earned +87% over the next year. Those who panic-sold locked in 30%+ losses and missed the entire recovery.
Availability Heuristic: The News Makes It Feel Worse
Financial media profits from fear. During crashes, every headline screams catastrophe. This creates an "availability cascade" where the constant drumbeat of negative news makes the situation feel far worse than reality.
2022 example: Headlines screamed "worst year since 2008" as the S&P 500 dropped 18%. But diversified 60/40 Growth/Floor portfolios only fell 13%. And just 12 months later, the S&P was back to new highs.
The investors who sold in October 2022 locked in losses while patient investors who held captured the entire 2023 recovery (+24%).
The Brutal Math: How Market Timing Destroys Your Returns
| Scenario (2000-2024) | Initial Investment | 20-Year Outcome | Market Timing Cost |
|---|---|---|---|
| Fully Invested (7.5% annualized) | $100,000 | $424,785 | — |
| Missed 10 Best Days (3.4% annualized) | $100,000 | $196,156 | -$228,629 |
| Missed 20 Best Days (0.1% annualized) | $100,000 | $102,012 | -$322,773 |
4 Simple Rules to Beat Your Brain and Build Real Wealth
Get your free behavioral risk analysis and see where you stand.
Data sources: S&P 500 Total Return data from FRED (Federal Reserve Economic Data) and Robert Shiller's database (2000-2024), historical bear market data from Robert Shiller's database and NBER recession dates, behavioral finance research from Kahneman & Tversky (1979) on loss aversion, and market timing analysis methodology from industry-standard "missed best days" studies. All returns include reinvested dividends and are nominal (not inflation-adjusted). This content is educational and not financial advice. Consult a licensed advisor for personalized guidance.
Related Articles
Performance Chasing Costs $850K: The Vanguard Behavior Gap
Vanguard research: investors chasing hot sectors underperform by 1.55% annually. On $250K over 25 years, that's $850K lost. Four rules to stop the bleed.
14 min readPortfolio Drift: Your 60/40 Became 82/18
A 60/40 portfolio drifted to 82/18 by 2022, costing $55K on $500K. Use our free calculator to check your own drift and get a rebalancing plan in seconds.
7 min readInvestment Fees Cost $810K Over 30 Years
A 1% fee costs $314K over 30 years on $100K. See your exact fee drag, compare funds to low-cost alternatives, and find what's silently draining your returns.
8 min readContinue the Series
This is Week 1 of our 8-part investment mistakes series.