Investment Fees Cost $810K Over 30 Years
Investment fees reduce returns by compounding in reverse — every dollar paid in fees loses not just its face value but all future growth it would have generated. A 1% annual fee on a $100,000 portfolio costs $314,000 over 30 years at 7% gross returns; a 2% fee costs $810,000 — more than 8x your original investment, silently transferred from your retirement to fund managers.
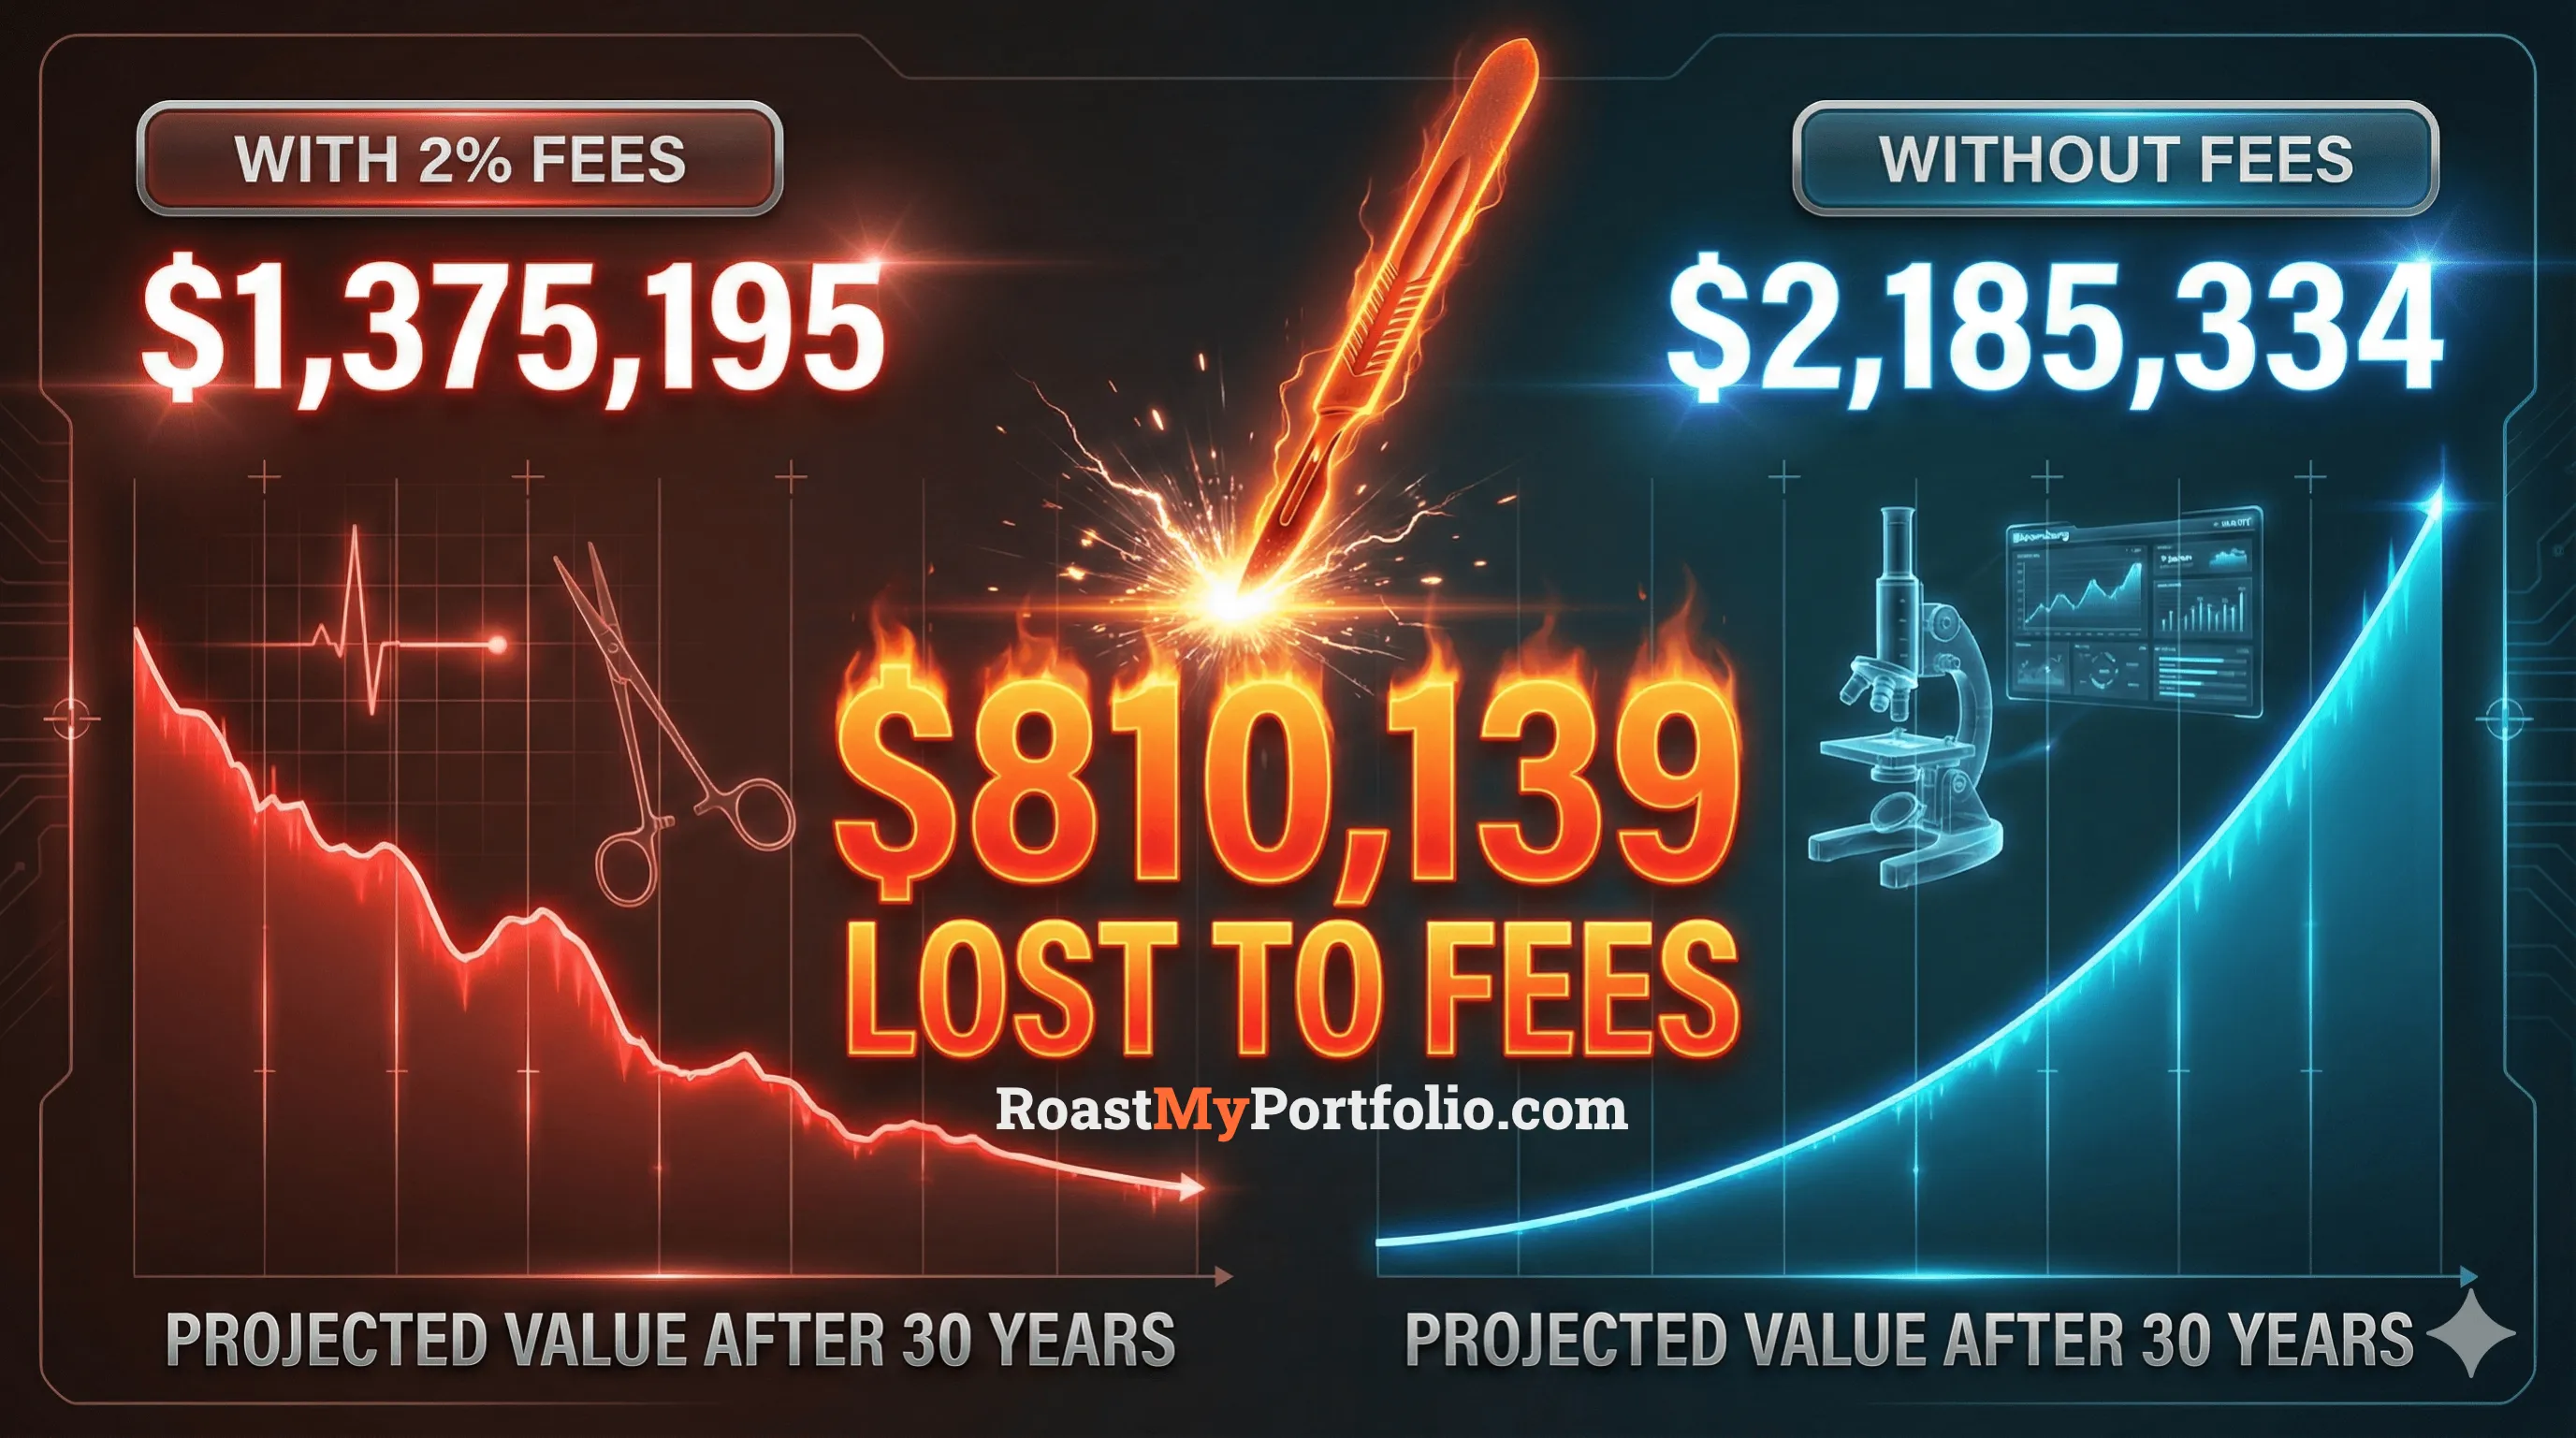
A 2% annual fee doesn't sound like much. But over 30 years, it silently steals $810,139 from a $100,000 portfolio that should have grown to $2.2 million. That's not a typo—you lose more than 8x your original investment to fees, while your advisor or fund manager captures wealth that should have been yours.
Our analysis reveals that the median investor pays an "all-in" fee of 1.72% annually—but they're only aware of the 0.55% expense ratio on their statement. That means 68% of total costs are invisible, quietly eroding returns through trading commissions, bid-ask spreads, cash drag, and advisor fees that never appear on your quarterly statement.
On a $500,000 portfolio, the 25-year difference between a low-cost 0.25% all-in fee and a typical 1.50% all-in fee is a staggering $533,469 in lost wealth (assuming 7% annual gross return). That's more than your entire initial investment—gone to fees.
- A 2% fee can cost you $810,139 over 30 years on a $100K portfolio
- 68% of total costs are invisible (hidden fees beyond expense ratios)
- Switching to low-cost index funds can save you $636K+ in lifetime fees
Calculate Your Investment Fee Drag
The magic of compound interest works both ways—it builds wealth slowly over decades, but it also amplifies the damage of fees. Use the calculator below to see your true cost of fees over time.
Why Investment Fees Feel Small But Cost Big
Small Numbers, Massive Impact (Exponential Blindness)
Our brains struggle with exponential math. "2% per year" feels negligible—just $2 on every $100. But compounded over 30 years, that seemingly tiny fee consumes 37% of your total portfolio value. We focus on dollar amounts today ("it's only $200 this year") while ignoring the exponential theft over decades.
The $100,000 example: After 30 years at 7% gross return, you'd have $2,185,334 with a 0.10% fee—but only $1,375,195 with a 2.00% fee. The fee didn't cost you 1.9% per year—it cost you 37% of your entire wealth.
Hidden Fee Layers (The Iceberg Effect)
Most investors only see the expense ratio printed on their fund prospectus. But that's just the tip of the iceberg. Below the surface lurk trading costs, bid-ask spreads, cash drag, sales loads, 12b-1 fees, and advisor fees that never appear on your statement.
- Advisor fee (visible): 1.00%
- Underlying fund expense ratio: 0.50%
- Trading costs (bid-ask spread): 0.15%
- Cash drag (uninvested cash): 0.10%
- True all-in cost: 1.75% annually
You think you're paying 1%. You're actually paying 1.75%—75% more than you thought.
The "Active Management" Trap
Active fund managers justify high fees by promising to "beat the market." But decades of data from S&P Dow Jones Indices SPIVA show that 85% of active managers underperform their benchmark over 15 years—after fees. The few who do beat the market rarely repeat their performance.
85% of active fund managers underperform their benchmark over 15 years—after fees
Source: S&P Dow Jones Indices SPIVA 2024
$810K Stolen: The 2% Fee Nobody Explains
| Annual Fee | 10 Years | 30 Years | Wealth Lost vs 0.10% |
|---|---|---|---|
| 0.10% (index fund) | $195,487 | $2,185,334 | — |
| 0.50% (low-cost active) | $187,715 | $1,979,932 | -$205,402 |
| 1.00% (typical advisor) | $177,308 | $1,749,143 | -$436,191 |
| 1.50% (high-cost active) | $167,449 | $1,548,935 | -$636,399 |
| 2.00% (all-in typical) | $158,116 | $1,375,195 | -$810,139 |
- 4 years of Harvard tuition for your kids ($85K/year x 4 = $340K+)
- Down payments on 8 median US homes ($100K each)
- Your entire retirement healthcare costs (avg $315K Medicare + $495K other)
- 32 years of max Roth IRA contributions ($25K/year x 32)
How to Slash Your Investment Fees
Most investors lose $400K+ to fees they didn't even know existed. Get a free 2-minute analysis of your portfolio's true all-in cost.
Data sources: Fee impact calculations using compound interest models, S&P Dow Jones Indices SPIVA scorecards 2024, Morningstar "Predictive Power of Fees" study, Vanguard Index Fund Research. All calculations assume 7% gross annual return before fees. This content is educational and not financial advice. Consult a licensed advisor for personalized guidance.
Related Articles
Portfolio Drift: Your 60/40 Became 82/18
A 60/40 portfolio drifted to 82/18 by 2022, costing $55K on $500K. Use our free calculator to check your own drift and get a rebalancing plan in seconds.
7 min readDiversification Illusion: Why 10 Stocks = 1 Risk
You own 15 stocks and still have one bet. Here's how to spot fake diversification, hidden correlation, and the tech-heavy echo chamber most portfolios fall into.
11 min readPerformance Chasing Costs $850K: The Vanguard Behavior Gap
Vanguard research: investors chasing hot sectors underperform by 1.55% annually. On $250K over 25 years, that's $850K lost. Four rules to stop the bleed.
14 min readContinue the Series
This is Week 4 of our 8-part investment mistakes series.